CoPlot's Drawing Objects
(for
technical drawings like genetic maps, field maps, flow charts,
apparatus diagrams, circuit diagrams,
and chemical structures)
CoPlot's versatile drawing objects make it easy to create precise technical drawings. Although there are just a few types of drawing objects, each object has a large number of attributes which you can edit. The result is that each type of drawing object can be used in many different ways.
To use CoPlot, you:
- Create different types of drawing objects.
Use the 'Create' menu or the buttons on the upper left edge of CoPlot's window. - Edit the attributes of the objects until they look like you
want them to look.
You can edit objects immediately after you create them or any time afterwards.
Use the 'Edit' menu or the buttons on the lower left edge of CoPlot's window.

The types of drawing objects are:
- Path Objects -
'Path' objects are a series of points and a group of
attributes. Path objects are very versatile because
they have line attributes,
background attributes, fill (hatch) attributes, arrow
attributes, and marker attributes.
Whenever possible, CoPlot supports an infinite
number of sizes and line widths, not just a few
(for example, for fill size, marker size, line width).

The drawing below illustrates some uses of Path objects. By setting the 'Path Type' attribute to 'Spline', it is easy to make nicely curved lines. The 'Background Color' attribute allows you to color the interior of the wing's outline. Path objects can also be used to draw straight lines and dashed lines (also in the drawing below).
- Ellipse Objects -
'Ellipse' objects in CoPlot are very flexible.
They can be made into a large variety of shapes
by changing their attributes.

- Image Objects -
'Image' objects can display images from
standard image files (.gif, .jpg, .png, etc.).
You can change an Image object's attributes to
change the image's appearance: size, angle (in decimal degrees),
brightness, contrast, cropping margins, etc.
And you use other drawing objects to annotate images.
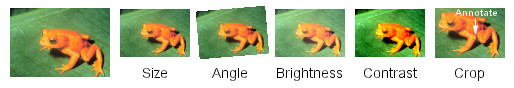
Image objects can also display icons (32x32 pixel images). CoPlot comes with thousands of icons arranged in 70 icon groups (animals, plants, people, computers, etc.). Icons look great on screen, but don't look as good when printed. They are very useful for creating diagrams which will be viewed on screen.
- Text and Big Text Objects -
Text and Big Text Objects are almost identical.
The only difference is that you edit the text for
a Text object in a textfield and you edit the
text for a Big Text object in a text editor. Thus,
Text objects are more suitable for short pieces of text
and Big Text objects are more suitable for big blocks of text.
Text and Big Text objects in CoPlot can be drawn within a shape. There are about 40 shapes to choose from. This makes it easy to draw block diagrams, flow charts, UML diagrams, organization charts, etc.
Tags For Formatting Text - Text in CoPlot can include HTML-like tags to control subscripts, superscripts, italics, underlining, bold, etc. For example, '<b>' makes subsequent text bold. CoPlot supports some non-standard tags to help you format mathematical equations. Wherever tags can be used in CoPlot, there is an '&' button which pops up a list from which you can pick a tag. Here are examples of most of the tags:

Greek and Other Special Characters - Text in CoPlot can include Greek and other characters which are picked from lists of HTML-like character entities (ASCII names for characters, for example, 'Á' generates 'Á' and 'μ' generates 'µ') which are arranged in groups. Wherever character entities can be used in CoPlot, there is a '<>' button which pops up a list from which you can pick a character. Here are samples from most of the character groups:
Here is the list of characters in the Math group:
- Dimension Objects -
Dimension objects mark the distance between two points.
In the text that is centered between the two points,
you can embed a special text tag
("<dimension>") to display the current distance.
If the two points
are too close together to fit the text, two
short arrows are drawn inward to the two points.
There is no special "arc dimension" object. But since ellipse objects can be made into arcs with arrowheads at both ends and with text labels, they can be used to label arc dimensions. In the text for the ellipse's label, you can embed a special text tag ("<arcdimension>") to display the current arc dimension.
- Graph Objects -
Because graph objects are a standard type of drawing object,
you can create as many of them as you want anywhere on your
drawing.
And the extensive drawing options in CoPlot are
very useful for annotating graphs.

Graph objects are discussed in detail here.
- Pie Charts and Plasmid Maps -
Strictly speaking, pie charts aren't a standard type of
drawing object in CoPlot. But CoPlot has a "wizard"
("Create : Pie Chart")
which takes a column with numeric data and
a column with labels
from a datafile and makes
a pie chart or plasmid map
by creating several Ellipse objects. You can
then further edit the attributes of
these ellipse objects if you need to.


Note that text label for each Ellipse object can include special characters (for example, Greek and math) and various formatting commands (for example, subscripts and superscripts).
If you use "Create : Pie Chart" a few times and edit the attributes of the resulting ellipses (notably, their Size and Inner Size), you can make a multi-pie chart:

Go to: CoHort Software | CoPlot | Top
Sample Drawings
The features of CoPlot described above (different types of drawing objects, text tags, and special characters) combine to make it easy to make a broad range of technical drawings. Here are some examples.
Electrical Schematics - Because electrical symbols are in one of the groups of special characters, it easy to draw electrical schematics. Here are the electrical symbols and a simple schematic drawing:


Chemical Structures - CoPlot isn't specifically designed for drawing chemical structures, but it has some features which make it pretty easy to do. One of the lessons in the program describes how to do it.
Landscape Designs - CoPlot has a font with landscape symbols, which simplifies the process of making landscape designs and field maps.
Field Maps and Groups - In CoPlot, you can assign drawing objects to different groups and you can control whether different groups are visible or not. Thus you can make field maps where the map is in a background group and the crop history for each year is stored in a different foreground group (which you can make visible or not).

Here are some other drawings made with CoPlot.


Go to: CoHort Software | CoPlot Home Page | Top